How to work with VisuNet?
The VisuNet tutorial
Input formats
VisuNet works with any rule-based classifier in supported data frame formats.
‘Line by line’ format
Input data should be in a data frame format that contains the following columns:
features- the left-hand side of the rule corresponding to comma-separated attributes and their values, of type, type ‘factor’decision- the right-hand side of the rule corresponding to the decision value, of type ‘factor’accuracyRHS- the rule accuracy, of type ‘numeric’supportRHS- the rule support, of type ‘numeric’decisionCoverageorcoverageRHS- the fraction of correcly classfied objects, of type ‘numeric’
| features | decision | accuracyRHS | supportRHS | coverageRHS | pValue |
|---|---|---|---|---|---|
| ZSCAN18=1,NPR2=2 | control | 0.98521 | 19 | 0.32895 | 5.20e-06 |
| NCKAP5L=1,234817_at=1 | control | 0.97368 | 18 | 0.30196 | 1.45e-05 |
| MAP7=3,ATXN8OS=1 | control | 1.00000 | 18 | 0.29932 | 1.45e-05 |
| NPR2=2,CAPS2=3 | control | 1.00000 | 17 | 0.29296 | 3.97e-05 |
| MAP7=2,COX2=3 | autism | 1.00000 | 23 | 0.31507 | 6.77e-05 |
You can use the ‘line by line’ format with the option: type = "L"
R.ROSETTA data frame
The rules data frame that is the output of R.ROSETTA can be directly imported in VisuNet. See ?rosetta from the R.ROSETTA package for details.
The R.ROSETTA output format can be used with the option: type = "RDF".
#the rule-based model construction using R.ROSETTA
resultsRos <- rosetta(autcon)
vis_out <- visunet(resultsRos$main, type = "RDF")
Run VisuNet
VisuNet is an R package implemented as Shiny Gadgets.
require(VisuNet)

#Sample rule set for a classifier of  young males with autism and control
#'Line by line' data type
autcon_ruleset

#Run VisuNet
#Remember to click DONE once you finish working on VisuNet
vis_out <- visunet(autcon_ruleset, type = "L")
The available visunet parameters are:
ruleSet- the appropriately formatted set of rules: Input formatstype- a character string specifying the type of the input data:"RDF"- the R.ROSETTA output (see R.Rosetta format)"L"- the “Line by line” file format (see ‘line by line’ format) The default is"RDF"
NodeColorType- a character string specifying the color of nodes:"DL"- feature discretization levels, option is available for data discretized into three levels: 1 - , 2 - and 3 - . In the case of gene expression, data discretization levels correspond to: 1 - under-expressed gene, 2 - no change gene expression and 3 - over-expressed gene."A"- color of nodes defined by the mean accuracy value for the node.
NodeSize- a character string parametr for scaling the node size:"DC"- the mean decision coverage for the node"S"- the mean support for the node
Please note that the node scaling is perfomed per decision. See ?visNodes for the node scaling details.
CustObjectNodes and CustObjectEdges parameters are optional and can be used when rule network customization is needed.
CustObjectNodes- a list that contains the customized VisuNet output for nodes. The list needs to contain two variables:nodes- a customized VisuNet output for nodesCustCol- the names of variables added/changed in the VisuNet output for nodes.
See Node customization for details.
CustObjectEdges- a list that contains customized VisuNet output for edges. The list needs to contain two variables:edges- a customized VisuNet output for edgesCustCol- the names of variables added/changed in the VisuNet output for edges.
See Edge customization for details.
The interface
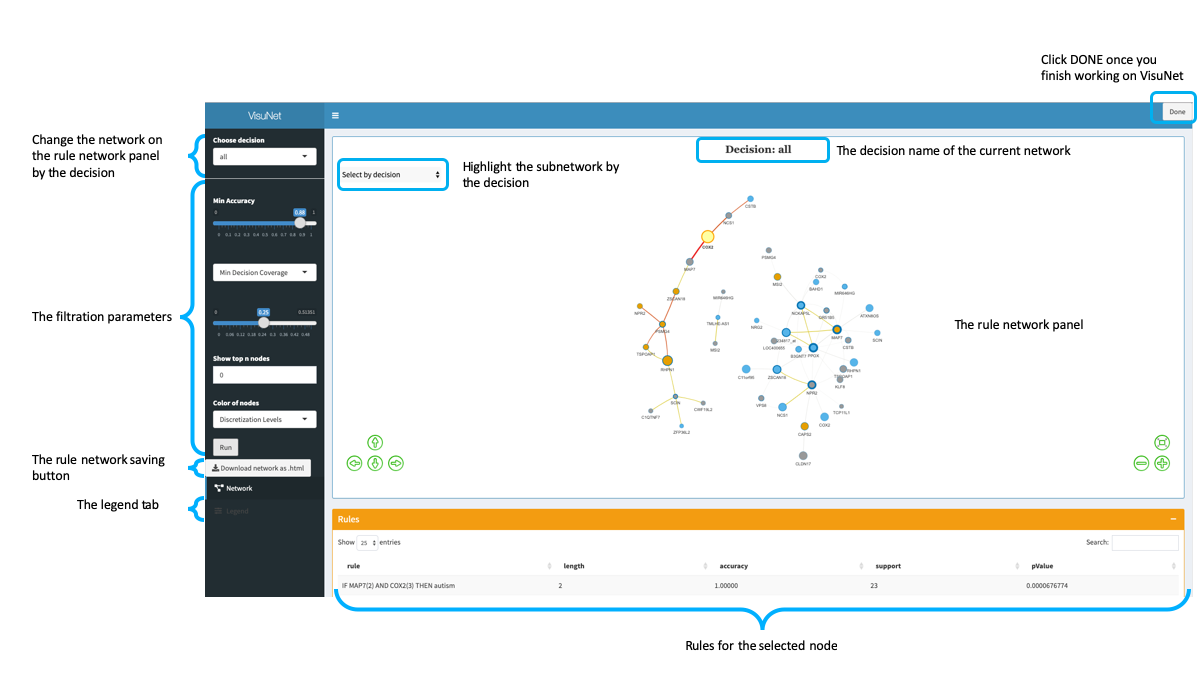 The VisuNet interface
VisuNet displays the rule network construct for the 10% of rules with the highest connection score. When only one decision variable is visible in the top 10% of rules, we extend the threshold to obtain rules for all decisions. The initial values of accuracy and support are defined for this set of rules.
The rule networks filtration panel:
min Accuracy- the minimum accuracy value for the set of rules that create the rule network- the user select the minimum decision coverage (
Min Decision Coverage) or support (Min Support) value for the set of rules that create the rule network Show top n nodes- enable to show the exact number of nodes according the connection value from the current rule network. Set “0” to switch off the parameterColor of nodes- the node color schema. SeeNodeColorTypein the Run Visunet section for details.
VisuNet output
The VisuNet output is a collection of lists corresponding to decision variables and an additional list for the combined decision “all”. The lists contain information required to reproduce the rule network, i.e. data frames for nodes, edges and RulesSetPerNode - a list that shows rules for each node. Data frames for nodes and edges incorporate essential variables from the visNetwork package and variables that describe the quality of each node/edge obtained from the rules.
Structure of the data frame for nodes:
id- a unique node id, based on attribute value and left-hand side value of the rule setlabel- the attribute variable without the “=value” part from the left-hand side of the rule setDiscState- the attribute valuecolor.background- the node color (see node color types in section Run Visunet for details)value- the node sizecolor.border- the color of the node bordermeanAcc- the mean accuracy value of all rules that contain the nodemeanSupp- the mean support value of all rules that contain the nodeNRules- the number of rules that contain the nodePrecRules- fraction of rules that contain the nodeNodeConnection- the total connection value obtained from the rules that contain the nodetitle- information visible on the tooltipgroup- the decision value that occurs most frequently (>50%) in rules associated with the node; otherwise group contains all comma-separated decision values corresponding to rules associated with the node. group defines the content of the “Select by decision” drop-down box.
Structure of the data frame for edges:
from,to- the pair of nodes that create the edge
conn- the connection variable obtained from the edge-associated rules.connNorm- the connection variable normalized according to the maximum connection variable in the rule networklabel2- the edge idcolor- the edge color
title- information visible on the tooltipwidth- the edge width, defined according to the normalized connection value
Rule network customization
Rule networks are constructed using the visNetwork package that enables adding and modifying node- and edge- properties. We can add other variables that are implemented in visNetwork. See ?visNodes and ?visEdges for a full list of available options.
Node customization
Example
We identified 11 genes previously reported in databases of autism associations: SFARI, AutDB and ASD. In this example we would like to mark those genes as stars.
#genes reported in databases of autism associations
aut_genes <- c("TSPOAP1", "COX2","NCS1","RHPN1","FLRT2",
              "BAHD1","NCKAP5L","PPOX", "NGR2",
              "ATXN8OS","DEPDC1")

#create a new variable that contains node information for the "all" decision
nodes_RNO <- vis_out$all$nodes

#create a new vector of variables: shape. "dot" is the default shape of nodes
nodes_RNO$shape <- rep("dot", length(nodes_RNO$label))

#mark selected genes as stars using the label attribute
nodes_RNO$shape[which(as.character(nodes_RNO$label) %in% aut_genes)] <- "star"

#create the node object list
nodesL <- list(nodes = nodes_RNO,CustCol =  c("shape"))

#rerun VisuNet with the new shape for nodes
vis_out2 <- visunet(autcon_ruleset, type = "L", CustObjectNodes = nodesL)
To rerun VisuNet with the customized object for nodes, you need to provide the original rule set and a list CustObjectNodes that contains the customized VisuNet object for nodes. CustObjectNodes includes the customized object for nodes: nodes and a vector of column names that were changed/added to the object: CustCol.
Sample customized rule network for the young males classifier with autism and control from VisuNet. Marked genes reported in databases of autism associations (constructed for min decision coverage=27% and min accuracy=88%)
Edge customization
Example
Let’s assume that COX2 controls MAP7 and we would like to show the directionality of this edge in the rule network:
#mark the interaction between COX2 and MAP7 genes
edges_RNO <- vis_out$all$edges

#create a new vector of variables: arrows. "enabled" is the default variable for edges
edges_RNO$arrows <- rep("enabled", length(edges_RNO$label2))

#add direction to the selected edge using the label2 attribute
edges_RNO$arrows[which(edges_RNO$label2 == "COX2=3-MAP7=2")] <- "to"

#create the edge object list
edgesL <- list(edges = edges_RNO,CustCol =   c("arrows"))

#rerun VisuNet with a new variable for edges
vis_out3 <- visunet(autcon_ruleset, type = "L", CustObjectNodes = nodesL, CustObjectEdges = edgesL)
We can rerun VisuNet using customized objects for edges by providing the original rule set and a list CustObjectEdges that contains the customized VisuNet object for edges. CustObjectEdges includes the customized object for edges: edges and a vector of column names that were changed/added to the object: CustCol.
We can rerun VisuNet using both customized objects: CustObjectEdges and CustObjectNodes.
Sample customized rule network for young males with autism and control classifier from VisuNet. Marked genes reported in databases of autism associations and the edge direction between COX2 and MAP7 (constructed for min decision coverage=27% and min accuracy=88%)
Network for alternative rule-based classifier
VisuNet can be used with any rule-based model as long as the input data is created in the VisuNet format. To show the universality of VisuNet we created an association rule-based model for the case-control study of autism based on an arulesCBA package.
Example
library("arulesCBA")


#create a training set by randomly selecting 48 objects from each decsion class
autcon_training <- autcon %>%
  group_by(decision) %>%
  sample_n(48, set.seed=1, replace =  FALSE) %>%
  as.data.frame()

#create a test set
id_training <- rbind(autcon_training, autcon) %>% duplicated()
id_test <- which(id_training[97:length(id_training)] == FALSE)
autcon_test <- autcon[id_test,]

# run the CBA classifier
classifier <-  CBA(decision ~ ., data = autcon_training)

#obtain rules from the model
rules <- DATAFRAME(rules(classifier), setStart = '',setEnd = '')

#format a left-hand side of rules
ruleslhs <- rules$LHS

#change discretization levels from intervals to 1,2,3
ruleslhs2 <- gsub( " *\\[-Inf.*?\\) *", "1", ruleslhs)
ruleslhs2 <- gsub( " *\\[.*?\\) *", "2", ruleslhs2)
ruleslhs2 <- gsub( " *\\[.*?\\Inf] *", "3", ruleslhs2)


#select required columns from the rules
rules2 <- rules %>%  dplyr::select(LHS:confidence)

#replace the original left-hand side of rules with the modified version
rules2$LHS <- ruleslhs2

#rename columns name to fullfil the VisuNet input format
colnames(rules2) <- c('features', 'decision', 'supportRHS', 'accuracyRHS')

# format support to obtain intiger numbers
rules2$supportRHS <- (rules2$supportRHS * 96) %>%  round()

#run VisuNet
vis <- visunet(rules2, type = 'L')
Rule-network created for an association rule-based model for case-control study of autism
© 2019 Komorowski's BioInformatics Lab,Uppsala University Contact: Karolina Smolinska